The Data explorer lets you filter data and perform calculations to swiftly obtain performance insights and generate reports.
Here’s how to start exploring.
First, choose between two sets of metrics: metrics related to couriers or OOH points (pickup and drop-off locations).
Choose a date using one of the predefined options—Yesterday, Last 7 days, or Last 30 days. You can also choose a custom date range by clicking on the calendar and selecting the start and end dates.
An interval determines how data is grouped over time:
Day – Data is aggregated per day
Week – Data is aggregated per week
Month – Data is aggregated per month
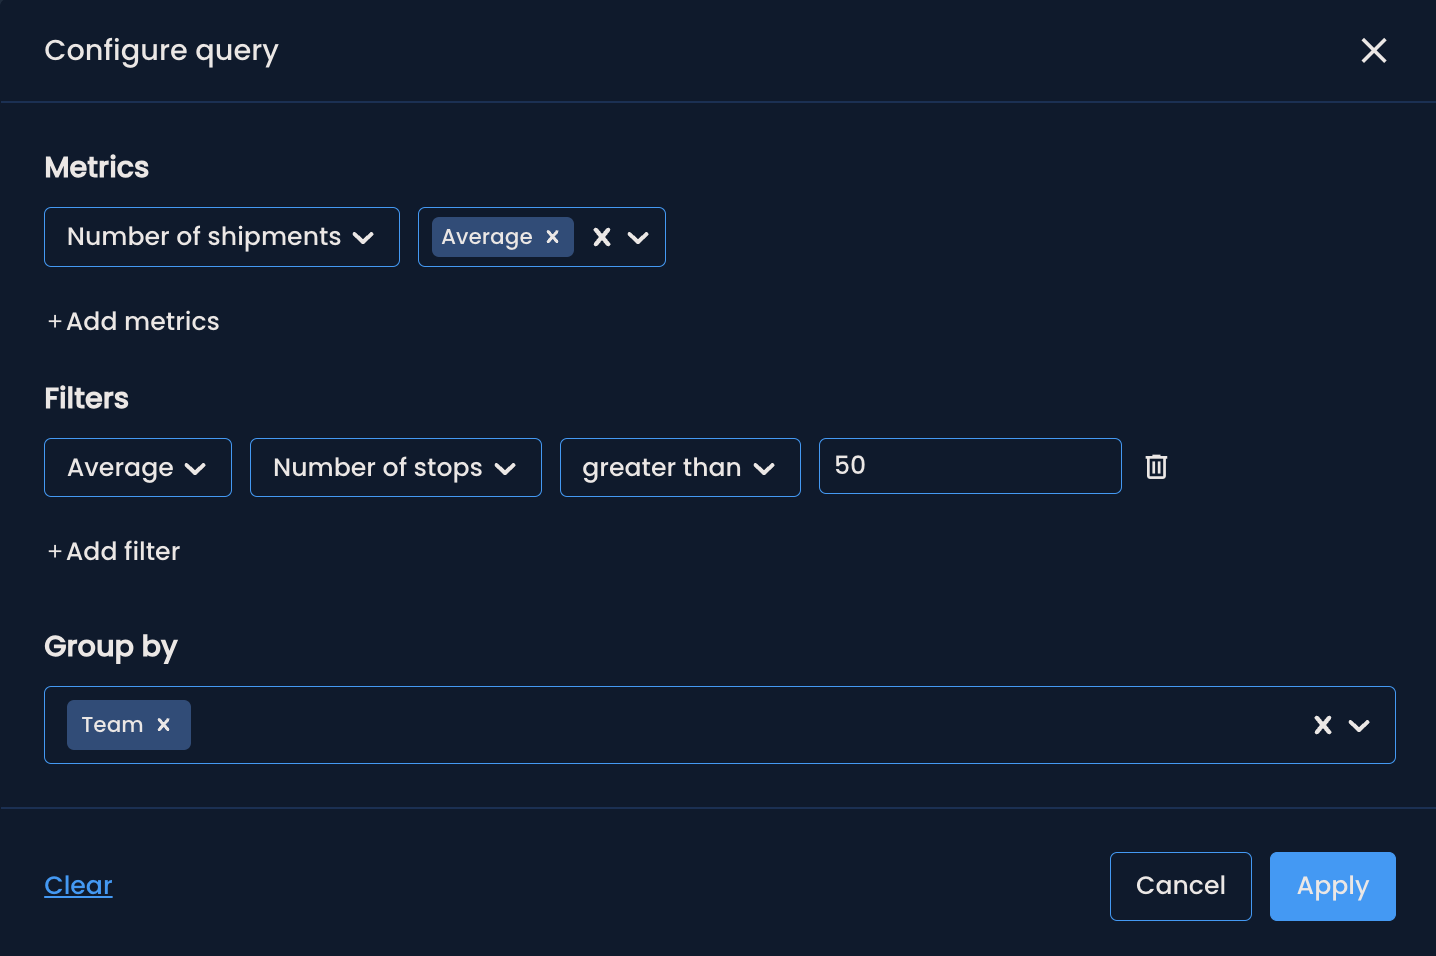
Click Filters to customize your query.
Metrics are the basis of your analysis. They’re types or categories of data points you can measure.
To select the metrics you want, click the +Add metrics button and choose one from the drop-down list.
Courier-related metrics available:
Shipments - Total number of shipments
Pickup shipments - Total number of shipments picked up
Delivery shipments - Total number of shipments dropped off
Total deliveries within 24/48/72 hours - Number of shipments delivered within the specified time window
Stops - Total number of times a courier stopped for a pickup or delivery
Pickup stops - Total number of stops made for a pickup
Delivery stops - Total number of stops made for a drop-off
Time out of region - Total time spent outside the delivery region
Breaks - Total number of times there was a gap of over 20 minutes between two stops
Total break time - Total duration of all gaps greater than 20 minutes between two stops
Longest break - Longest single gap greater than 20 minutes between two stops
Total mileage - Total distance traveled
Stem distance - Distance traveled from the hub to the first stop and from the last stop back
Delivery success rate – How many deliveries were successful out of all the assigned shipments (Successful deliveries / Total assigned shipments)
Pickup success rate – How many pickups were successful out of all the assigned pickups (Successful pickups / Total assigned pickups)
On-time delivery rate – How many deliveries were on time out of all the assigned shipments (Shipments delivered in a specific timeframe / Total assigned shipments)
On-time pickup rate – How many pickups were on time out of all the assigned pickups (On-time pickups/ Total assigned pickups)
Unsuccessful attempts - Total number of delivery or pickup attempts that didn’t succeed (e.g., not at home, no attempt)
OOH-related metrics available:
Drop-off shipments - Number of shipments successfully placed into a parcel locker or handed over to a shop and made available for collection (not yet collected by the recipient)
Delivery shipments - Number of shipments picked up from parcel lockers or shops
Pickup shipments - Number of shipments placed in lockers or handed over to a shop for further processing (returns, outgoing shipments)
Unsuccessful deliveries - Number of shipments that were not collected during the storage period
Rejected shipments - Number of shipments directed to a parcel locker that cannot be placed inside because the locker is full
Rejection rate - Share of shipments that were rejected because the locker was full, out of all delivery attempts to that locker (both rejected packages and successfully delivered packages – drop-offs)
(Rejected packages / (Rejected packages + Drop-offs))
Pending shipments - Number of shipments that are assigned to an OOH point but are still waiting to be delivered
Queue time - The number of days from when a courier picks up a shipment for delivery until it is made available at an OOH point for collection or further processing
Dwell time - Time in minutes a shipment spends at an OOH point, from when it is first placed there until it is collected or marked as unsuccessful.
Utilization rate - The ratio between the number of parcels delivered to a parcel locker and the locker’s total capacity
(Shipments delivered to the locker / Locker capacity)
Parcel locker volume - Total internal volume of a parcel locker in cubic meters, representing how much physical space is available for shipments
Distance from OOH point - Distance between the recipient’s address and the selected OOH point in kilometers
Once you’ve chosen your metrics, you can select the function you want to apply to them. Choose one or more functions from the list: total, average, minimum, and maximum.
If you wish to add more metrics, repeat the process.
To remove a metric, click the bin icon. To remove a function, click the x next to it.

Filters exclude unwanted data by clicking + Add filters.
Teams, couriers and OOH points as filters
Show results only for a certain team or courier by selecting one of the following options:
Team - This information is retrieved from your internal systems and cannot be manually modified on the Mily Tech platform.
Virtual team - Fictional teams created by users to organize couriers or OOH points for improved performance monitoring and analysis.
Courier - This information is retrieved from your internal systems and cannot be manually modified on the Mily Tech platform.
OOH point ID - The unique ID assigned to each locker or shop in your internal system.
You can only choose one team, a virtual team or a courier. Then, select the team or courier's name from the drop-down menu.
Metrics filters
You can filter results to display only those that meet certain criteria based on selected metrics. For example, you may want to view results only for couriers who, on average, have fewer than 50 stops.
To do this, choose a metric from the list and its function. Use conditions such as equals, greater than, less than, greater than or equal to, and less than or equal to, and enter the corresponding value related to the metric.
If you wish to add more filters, repeat the process.
To remove a filter, click the bin icon in the pop-up menu or the X in the filters bar that appears after you click Apply.
You can group results by teams, virtual teams, or couriers.
For example, if you want to analyze performance across multiple hubs simultaneously, select Team from the drop-down menu. The chosen metrics will be aggregated for each hub.
Click the Clear button to start over and remove all metrics, filters, and other query parameters.
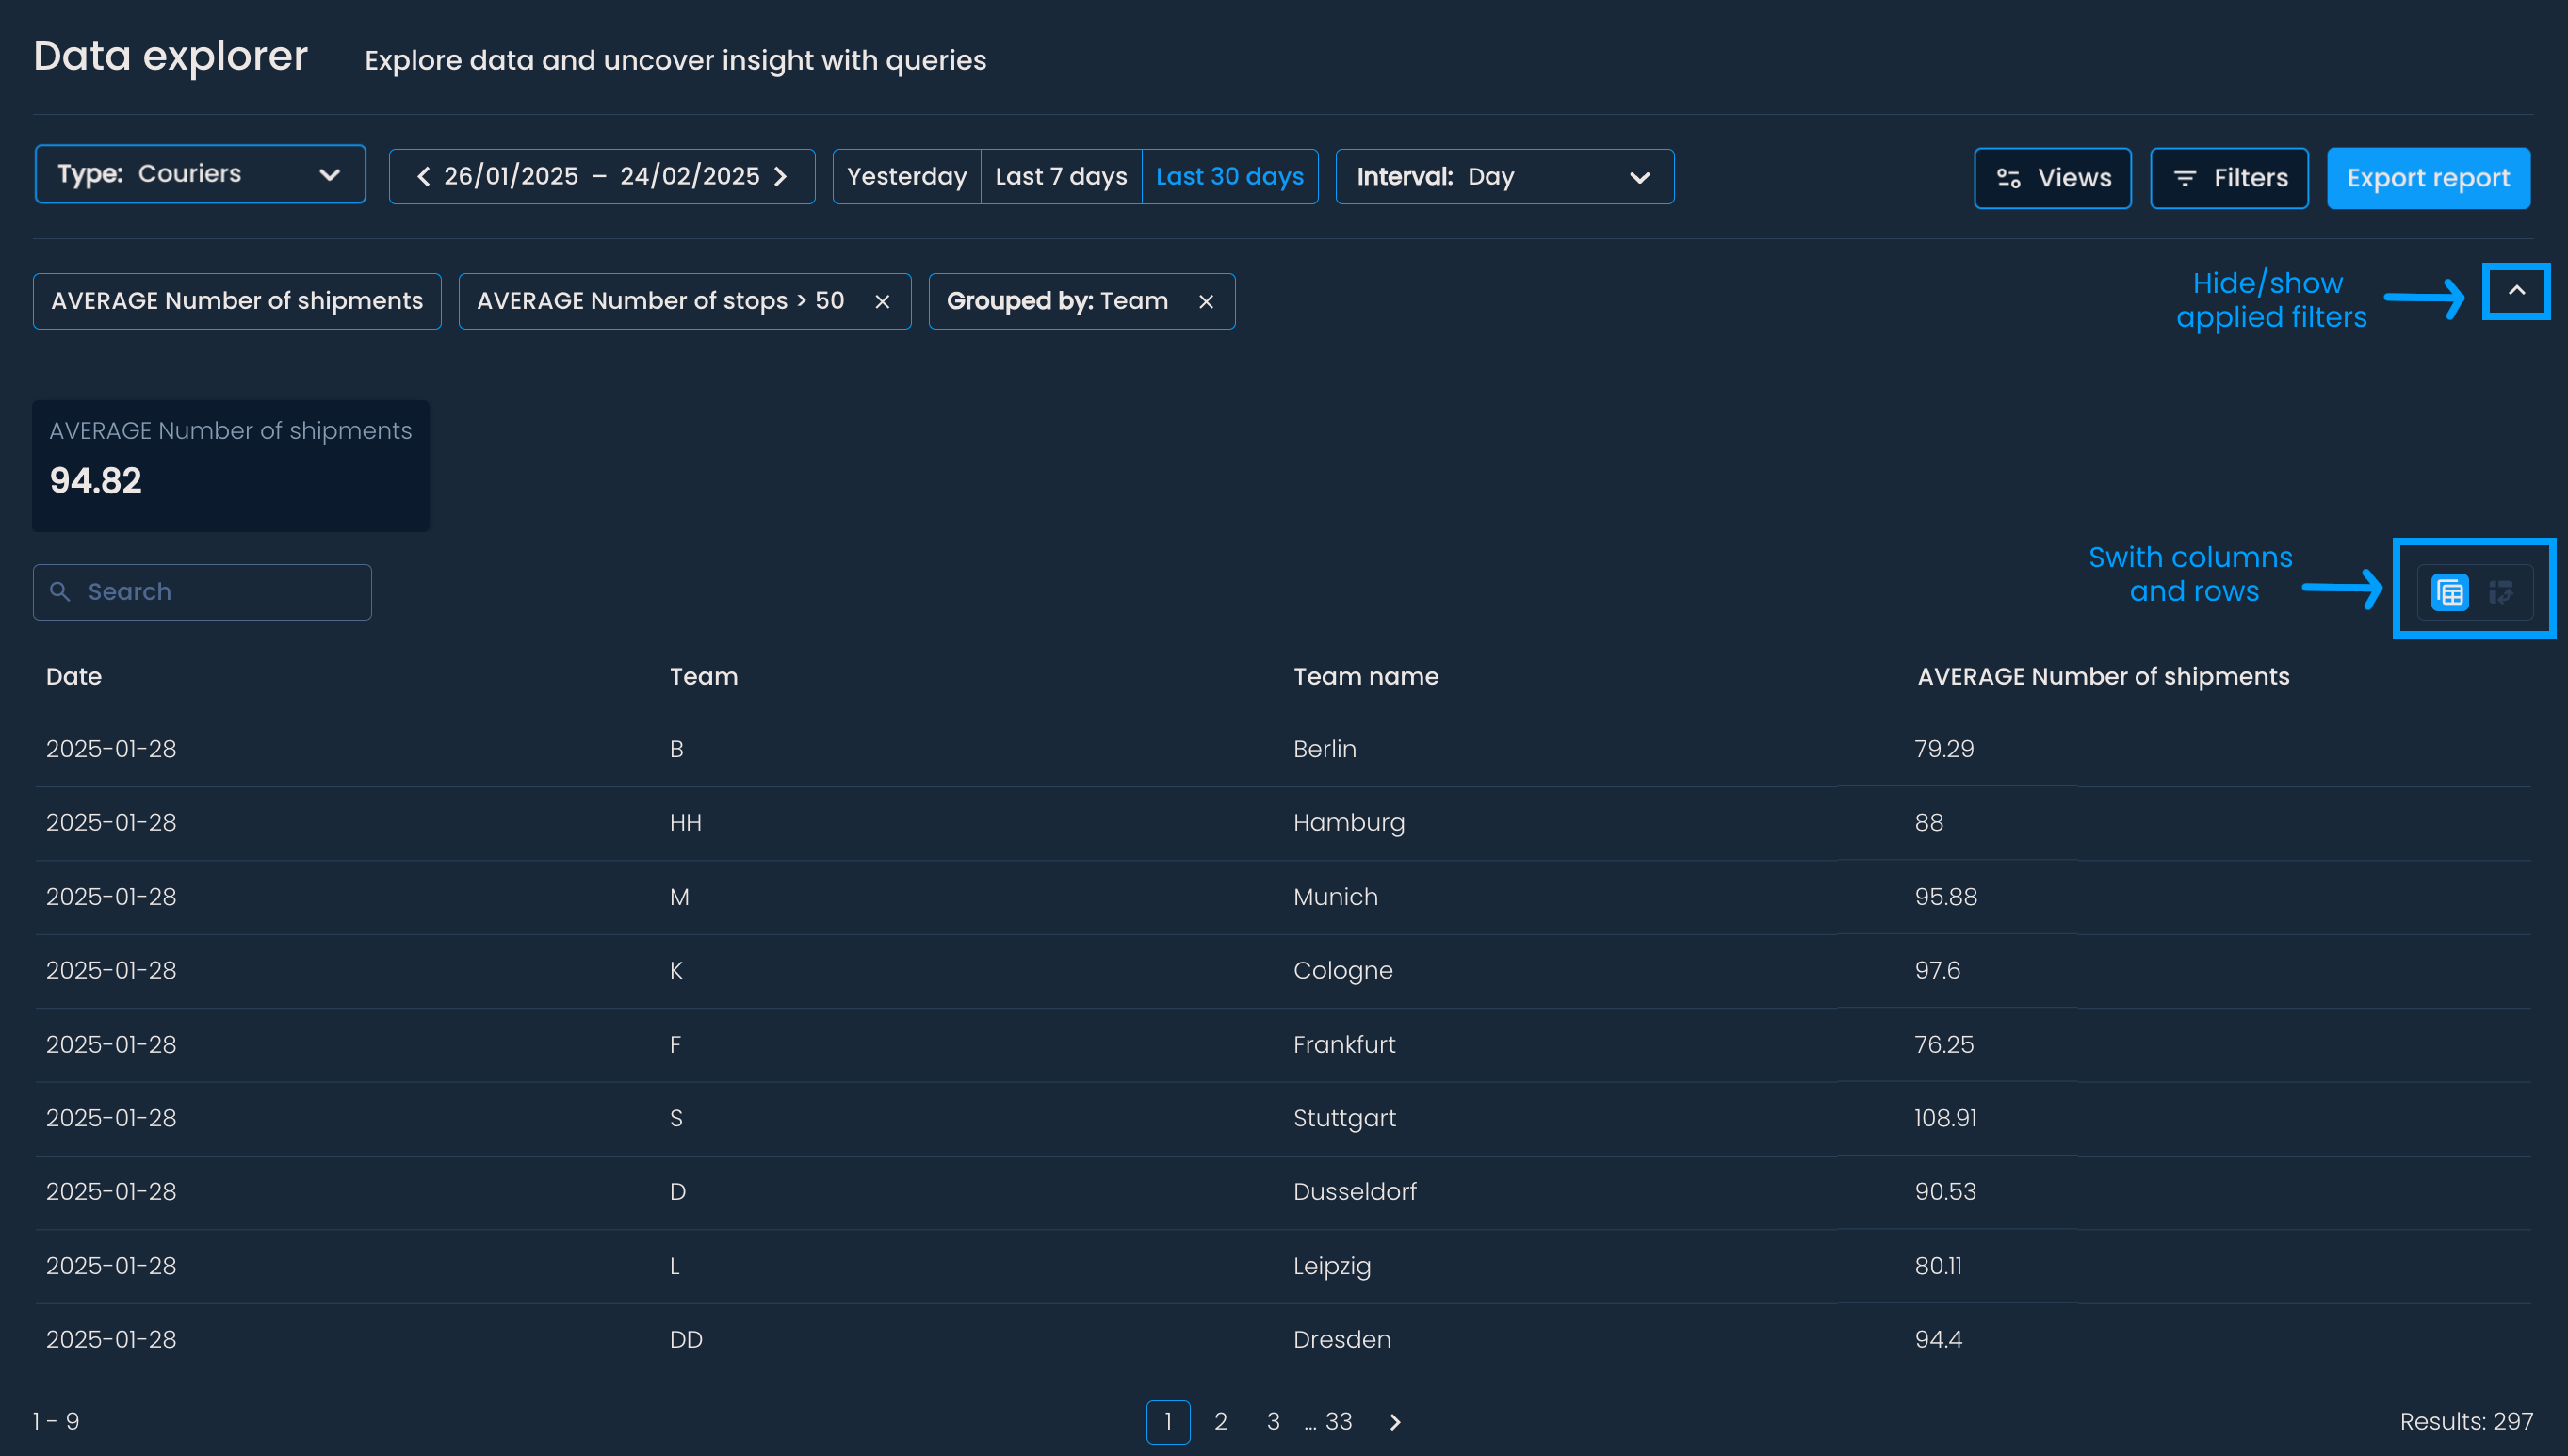
Once you click apply, you can dig into the results.
At the top, you will see aggregated metrics for all couriers or OOH points that match your filters. These metrics give you an overview of the selected data. For example, if you filter for couriers in Team Berlin, you will see the average number of shipments for all couriers in that team.
Below, you will find the results in a table. This table breaks down the data for each courier, OOH point, team, or virtual team. You can use the button in the top-right corner of the table to change how the data is displayed by turning columns into rows.
This format gives you a summarized view and a more granular breakdown of your data.
Save views as a way to preserve the exact setup (filters, metrics, and grouping) of your report, so you can return to it later or share it with teammates.
Once you’ve set filters, click Views > Save current view.
Name the view, then click Save.
When a view is loaded, the Views button updates to include its name (e.g., Views → Views: Stops last week).
To switch to another saved view, click Views again and select one from the drop-down list.
You can rename and delete any saved view.
If you wish to create a new report (‘exit’ a view), click Filters, clear the applied settings, and then choose new filters, metrics, and grouping.
Saved views are private by default, meaning they’re only visible to the creator. To share a view:
Copy the page URL and send it to a coworker who has a Mily Tech account and permission to see the entities (including relevant couriers/OOH points) referenced in the report.
Recipients will see the configuration, but they must save the view themselves if they want it to appear in their own list of views.