When conducting an Area or Leads analysis, you can use several tools to enhance the analysis. These tools are located in the toolbar at the bottom of the screen. Here's an overview of each one:
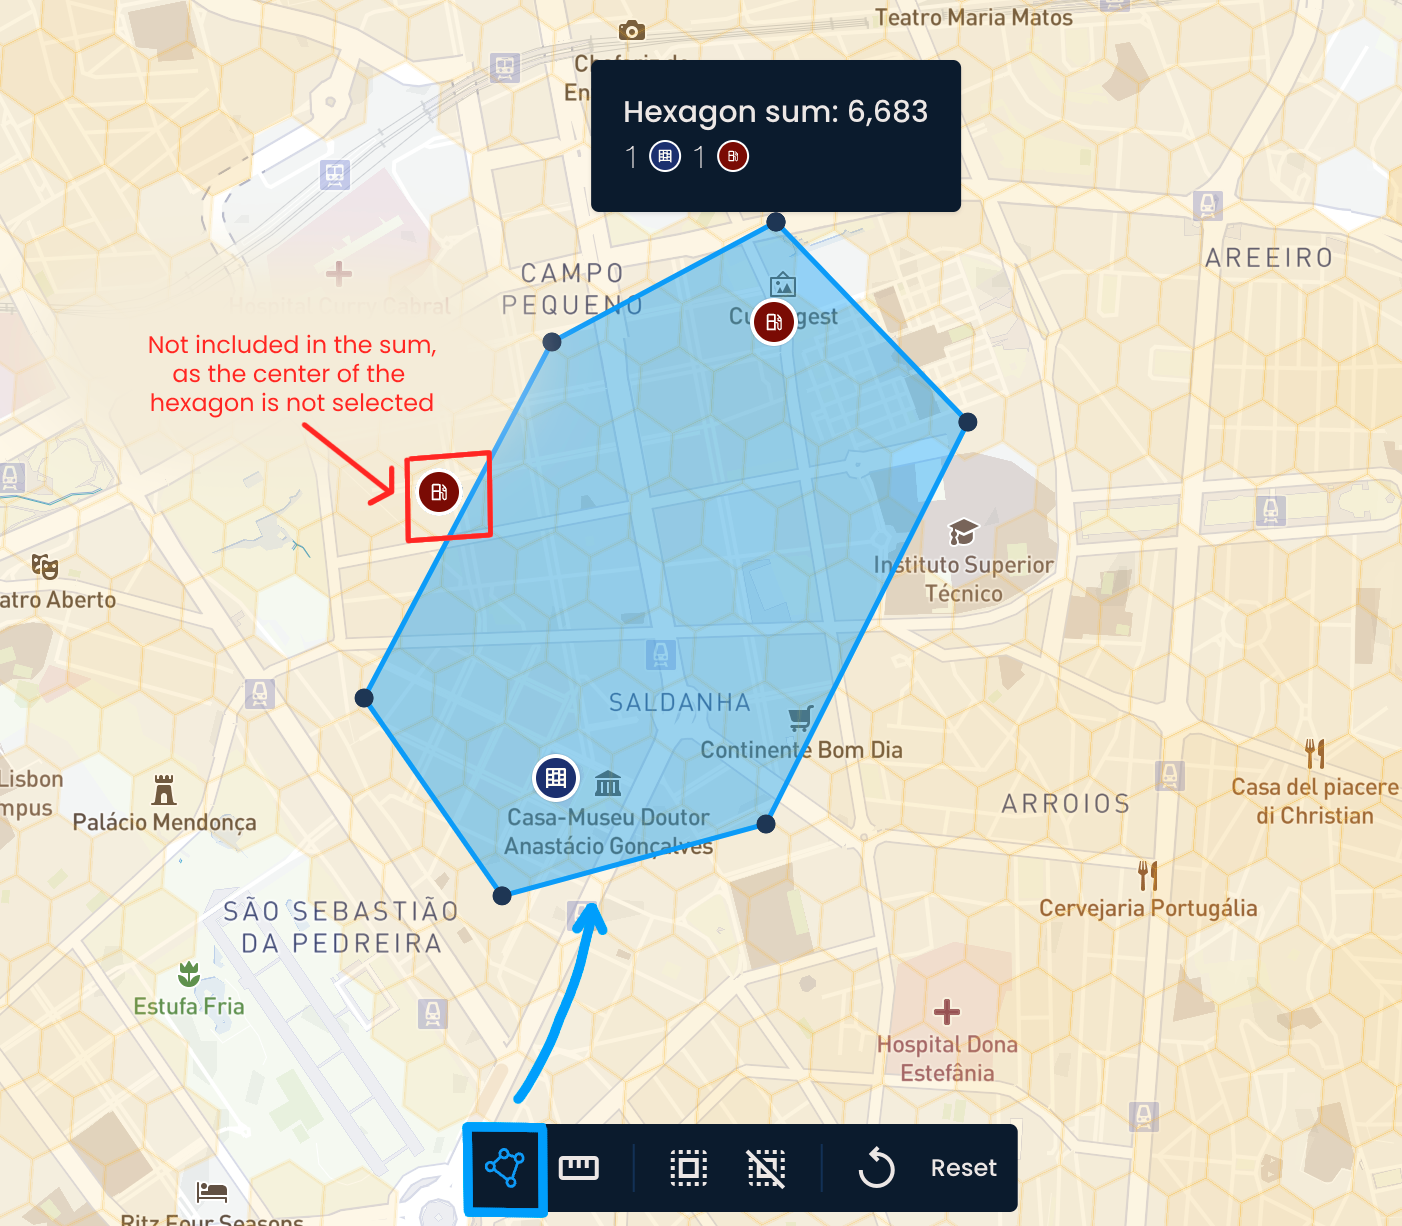
This tool allows you to sum data points within a selected area.
Click the Sum by area button.
To select a specific area, click on the map to create a starting point. Then, add more points to create the shape you want. Close the shape by connecting the last and first points.
The tool will count the data points shown in hexagons within the area, including parcel lockers, parcel shops, points of interest, distance pins, and generated locations.
To remove the selected area, click anywhere outside of it.

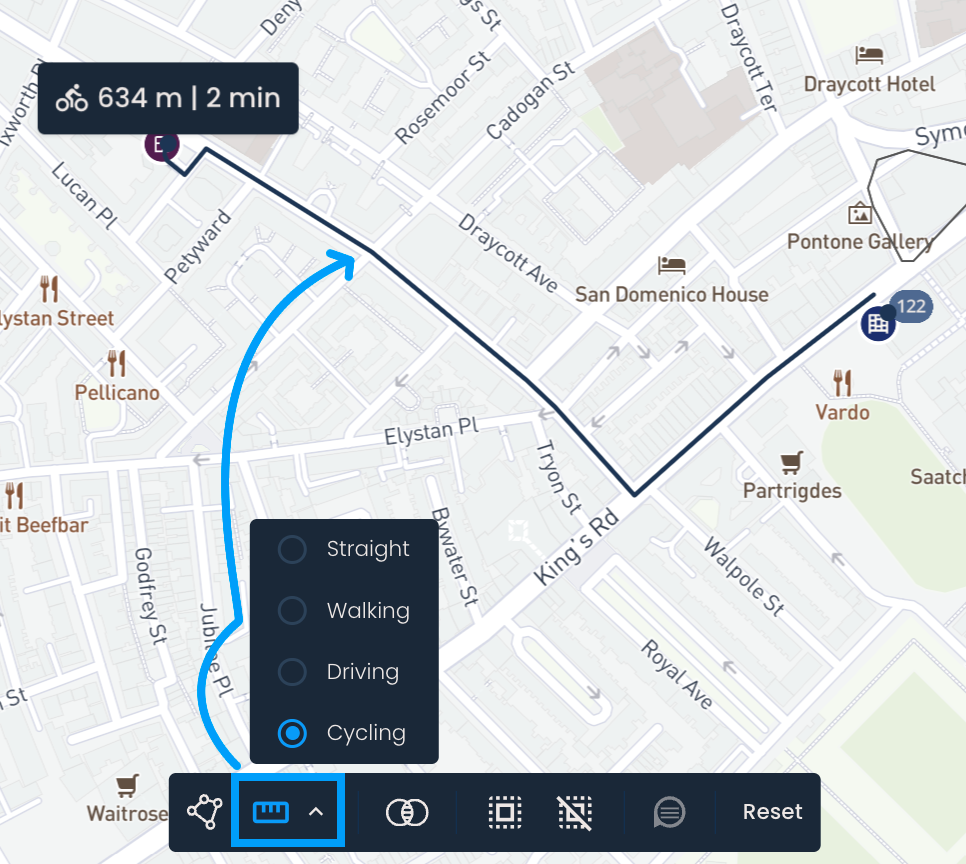
This tool allows you to easily measure the distance between two or more points, with several distance types (or modes of transportation) to choose from:
Straight - Measures the direct, point-to-point distance.
Walking - Uses sidewalks and trails to find the optimal pedestrian route.
Driving - Calculates the fastest vehicle route, favouring high-speed roads like highways.
Cycling - Selects shorter, bike-friendly routes by avoiding highways and favoring streets with bike lanes.
To use it:
Click the arrow next to Measure distance to choose a distance type (Straight, Driving, Walking, or Cycling).
Then, click the Measure distance button.
Click on the map to mark your starting point, then add one or more additional points. Click the final point again to finish the line or route.
The total distance will appear on the screen.
For Walking, Driving, and Cycling modes, the estimated travel time is also shown.
To clear the measurement, click anywhere outside of the drawn line.
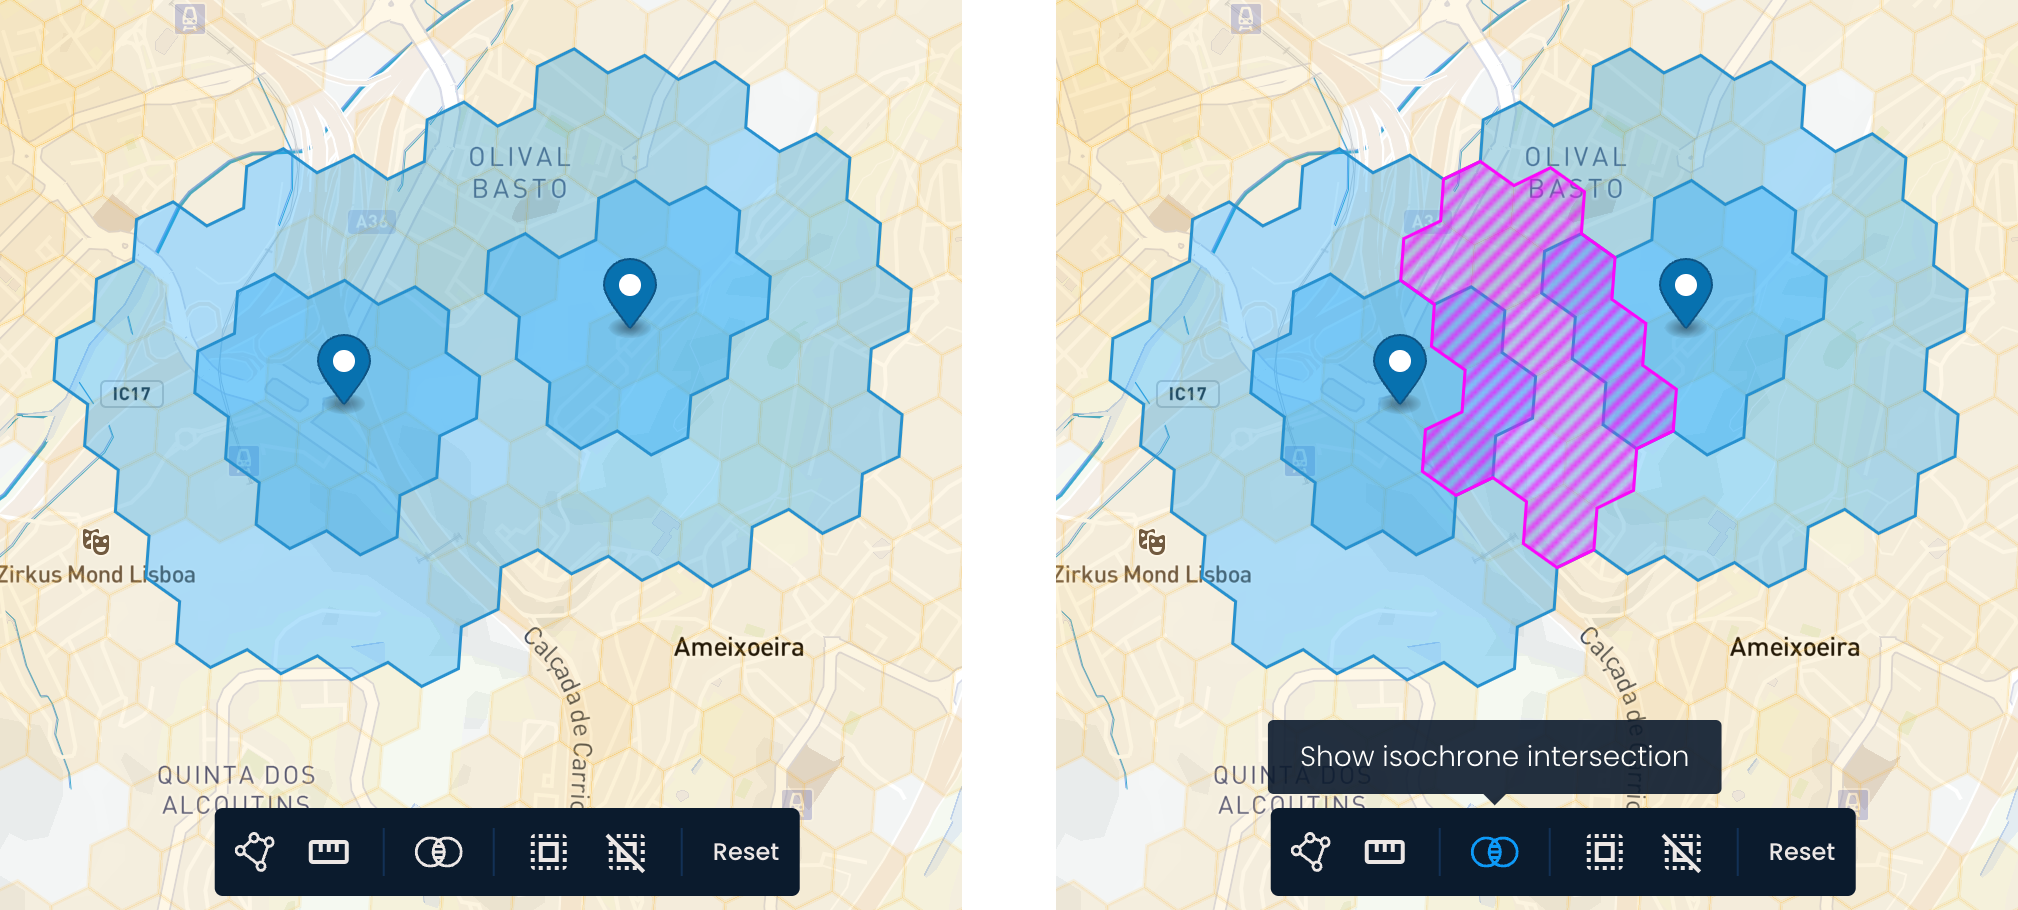
This tool highlights areas where two isochrones overlap.
Click the Show isochrone intersection button.
If two pins are positioned close enough that their isochrones overlap, the overlapping area will appear as hatched hexagons in a different color, making it easy to identify shared areas within the specified distance from each pin.
To turn off the overlap display, click the Show isochrone intersection button again.
Click Select All to select all locations shown on the map, including existing network locations (parcel lockers and parcel shops) and points of interest. The Selected locations menu will automatically activate, showing the total and individual coverage of all locations.
To deselect them, click the Deselect all button.

This button will be enabled after you save your Area analysis. Use it to revert the map back to the last saved state, undoing any changes you've made since then.

Clicking the Reset button clears the map entirely, returning it to an empty state. This option is only available during Area analysis.