In Area analysis, you can visualize your existing OOH network and explore individual location details directly on the map. This is usually one of the first steps when setting up your analysis – understanding what your current network looks like before assessing coverage or modelling changes.
Click Show current network and then choose the type of OOH points you want to view on the map. If the delivery area includes parcel lockers and parcel shops, both options will be available.
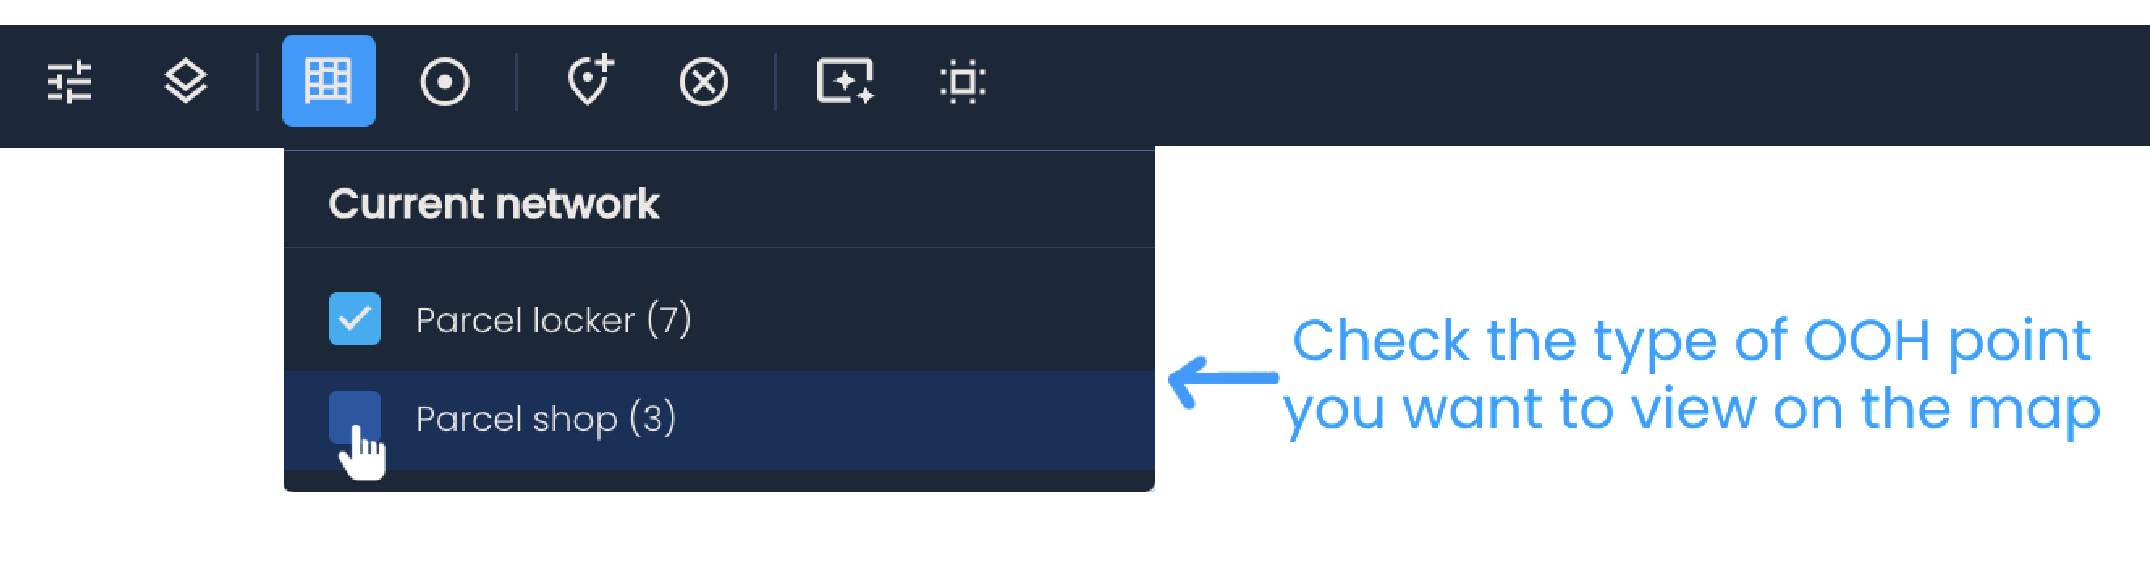

Once the locations appear on the map, you can:
Hover over any location to see its coverage based on the configured distance type.
Click on a location to visualize its catchment area.
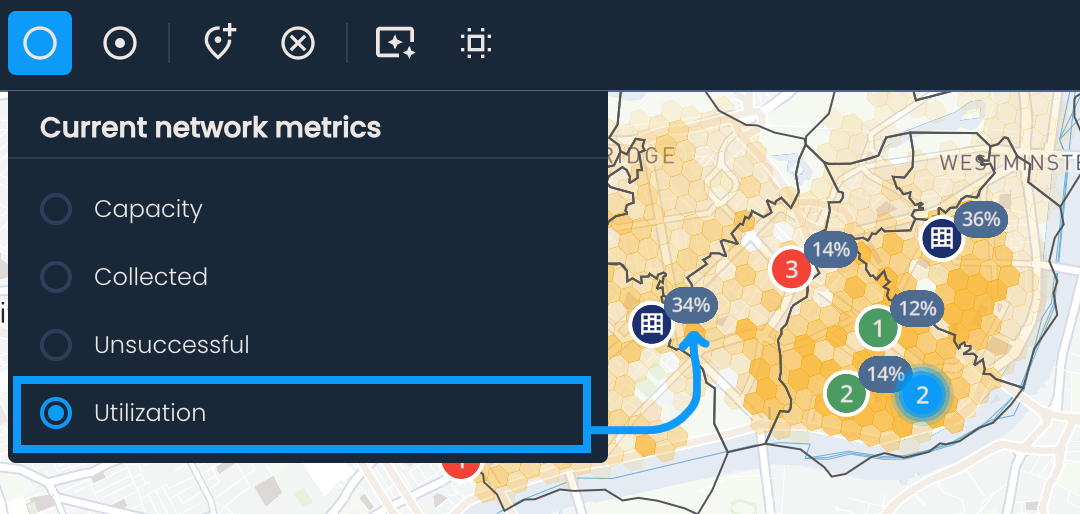
To overlay performance data on each location, click Change current network metric and select a metric, for example:
Capacity – maximum capacity of each location
Collected – number of shipments picked up by recipients
Unsuccessful – number of shipments not collected within the defined storage period
Utilization – ratio of delivered parcels to total capacity
The selected metric will update instantly for all locations in the network.
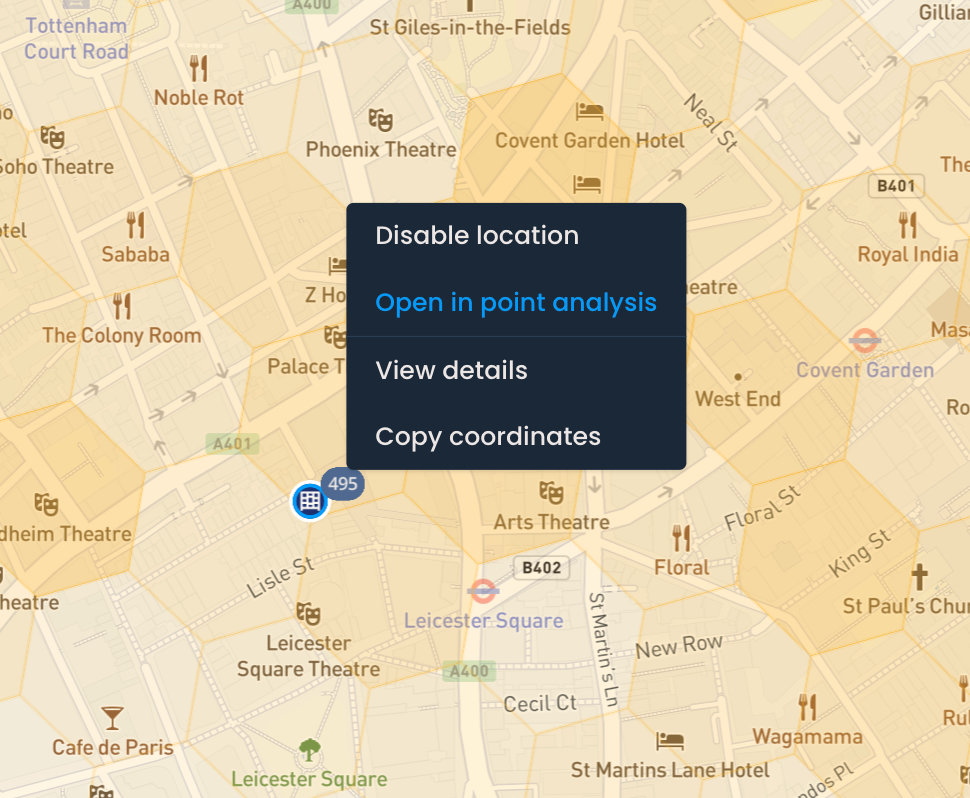
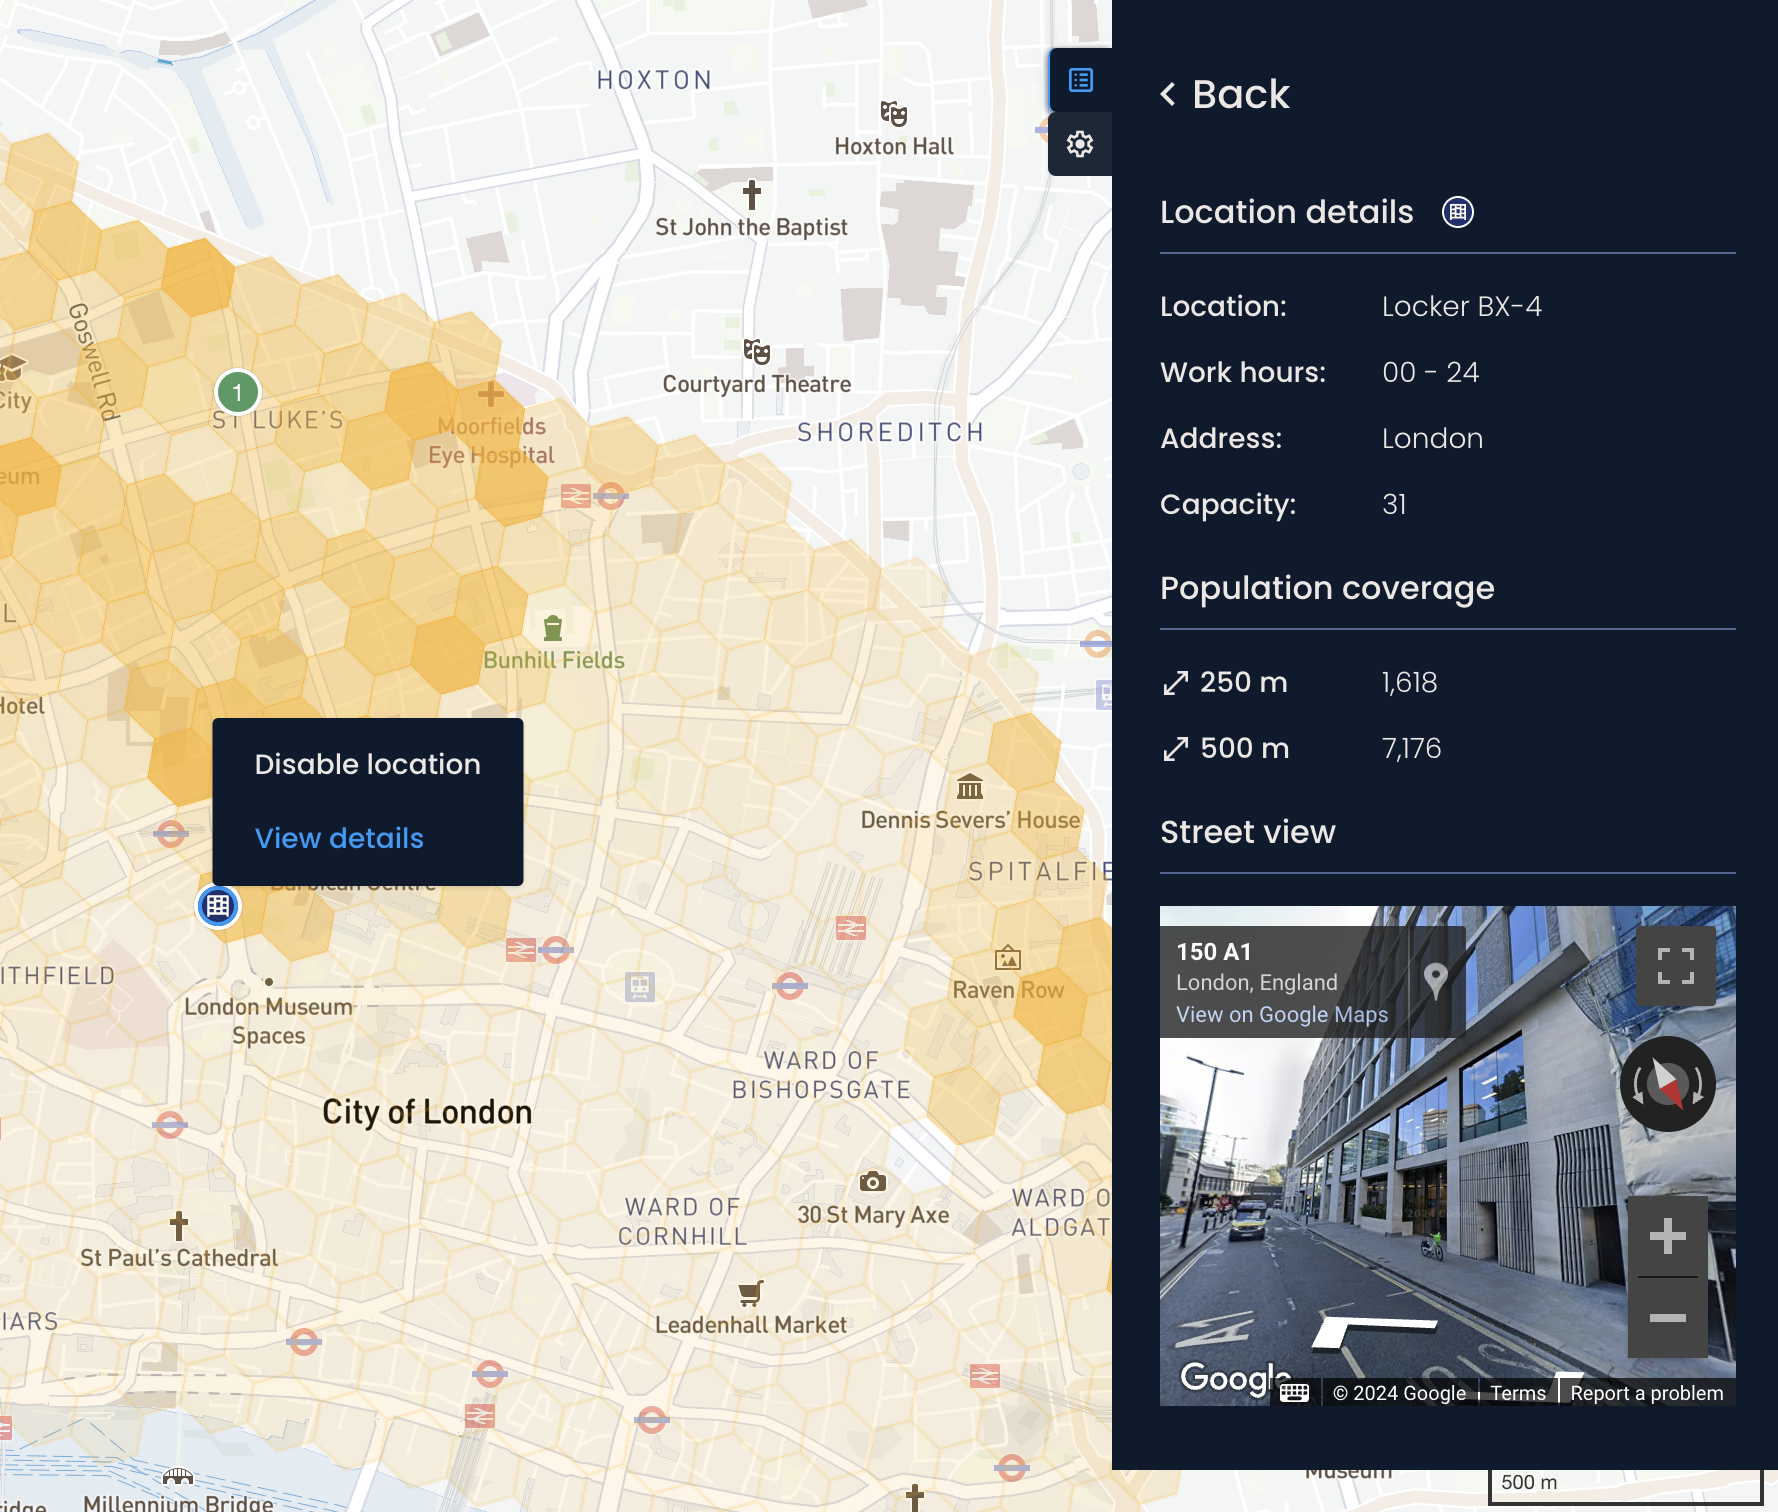
Right-click a location and select View details to access additional information, such as its working hours, capacity, and Street View.
To quickly access the performance details of a specific location without searching for it manually:
Right-click on a location and select Open in point analysis.
The OOH point analysis page will open in a new tab, showing the location's weekly performance.